
Getting Started with the QSpectrumAnalyzer on DragonOS
QspectrumAnalyzer is a powerful software tool designed for spectrum analysis and signal processing. In this DragonOS guide, we will provide you with step-by-step instructions on how to use QspectrumAnalyzer effectively for various applications. Whether you’re an aspiring RF engineer, an audio enthusiast, or a communication technician, this guide will help you harness the full potential of QspectrumAnalyzer.
User Interface
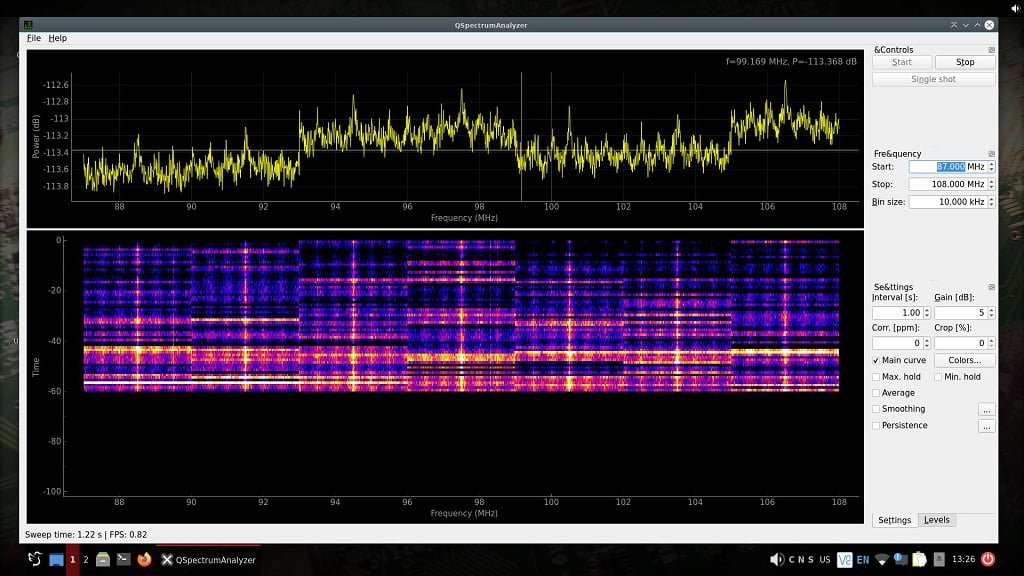
The interface consists of three main areas:
- Right-hand side settings panel is for configuration settings.
- Top window is to monitor spikes in the chosen frequency range. Every spike is some kind of broadcast.
- Bottom window is what is known as the Waterfall. A waterfall display shows a time-varying spectrum over a range of frequencies, allowing you to observe frequency activity changes over time.
Qspectrum Analyzer Configuration Settings:
Start/Stop: Similar to a traditional spectrum analyzer, this is to determine the range of frequencies to be analyzed by the SDR. You can specify the start and stop frequencies to focus on a particular range of interest.Bin Size: Is the width or size of each frequency bin in a discrete Fourier transform (DFT) or fast Fourier transform (FFT) analysis.Interval: is the time delay between each sweep.Gain: This amplifies the frequency so you can pick up weaker signals. You can essentially use the gain to control how far you want to receive RF signals from.Corr. (ppm): Is the correction of frequency accuracy or stability in parts per million (ppm).Crop (%): This is a data processing technique used to remove or eliminate a certain percentage of data points from the frequency spectrum. This cropping process is done to focus the analysis on a specific range of frequencies or to remove unwanted noise or artifacts.Main Curve: Activates the display of the captured data.Average: Averaging is used to reduce noise and improve the accuracy of the displayed spectrum. Average will calculate an average spectrum based on the captured data.Max/Min Hold: This displays and holds the highest and lowest points of the spectrum.Smoothing: When performing frequency analysis, the spectrum may contain random variations, known as noise, that can obscure the underlying signal or make it difficult to identify specific frequency components. Smoothing helps mitigate these variations and provides a clearer view of the dominant frequencies in the signal.Persistence: Holds all the data for each sweep on display.
A Basic Guide to Using Qspectrum Analyzer
Interface Overview:
- Upon launching, you’ll see the main interface with various menus, toolbars, and display panels.
- Familiarize yourself with the interface components, which typically include frequency controls, amplitude controls, and various display options.
Configuring Input and Output:
- Click on the “Settings” or “Options” menu to configure input and output settings.
- Choose your input source, such as an audio device or an RF receiver.
- Set the desired frequency range, resolution bandwidth, and amplitude settings.
Basic Spectrum Analysis:
- In the main display area, you can view the spectrum of the incoming signal in real-time.
- Adjust the center frequency and span to focus on the frequency range of interest.
- Observe the signal’s amplitude and frequency characteristics in the display.
Advanced Analysis Features:
- Utilize markers to measure specific signal parameters, such as frequency, amplitude, and bandwidth.
- Explore advanced display options like the spectrogram or waterfall view for time-frequency analysis.
- Access time-domain analysis tools if required.
Signal Processing:
- Qspectrum Analyzer may offer signal processing features like filtering, demodulation, or decoding.
- Apply these tools to enhance the quality or extract specific information from the signal.
Applications of Qspectrum Analyzer:
- Depending on your specific needs, use the software for various applications such as RF signal analysis or audio spectrum analysis.
Tips and Tricks:
- Explore shortcut keys and time-saving techniques to work efficiently.
- Customize the interface to suit your workflow.
- Be aware of common issues and how to avoid them.
Sample Projects and Use Cases:
- Check out sample projects and use cases provided by the software or create your own based on your area of interest.
Community and Support:
- If you encounter difficulties, seek help from the Qspectrum Analyzer community or the software’s support resources.
Basic FM Sweep
Spectrum analysis sweeps are performed to gain insights into the frequency content of a signal, identify specific frequency components, detect interference, assess signal quality, and evaluate system performance. The information obtained from the sweep helps in troubleshooting, optimizing, and designing various systems, such as wireless communication networks, audio systems, radar systems, and more.
As shown in the image below, I have set the spectrum analyzer to sweep the typical FM broadcast frequency range. I gave it a starting point of 87MHz and a stopping point of 108MHz. Each of the yellow spikes in the top window represent a broadcast being received.
Conclusion
By following this guide, you will become proficient in using Qspectrum Analyzer to analyze and process signals for your specific projects and applications. This software offers a range of tools to help you with your signal analysis needs, from RF signal characterization to audio processing.
That’s All Folks!
You can explore more of our beginners guides to radio here: Radio Adventures


What a very helpful and useful article. Easy to understand